If you want to view your performance versus a target for some metric like sales then a thermometer style chart is a great way to do this.
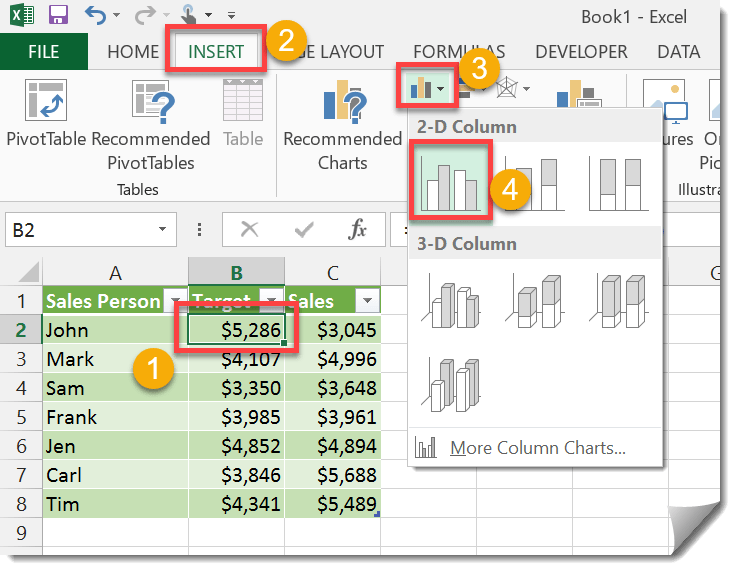
In this example we have a table with columns for the sales person, their target sales and the actual sales they had. We will create a 2D bar chart for this data.
Add your performance data to the secondary axis (in this case the sales data).
Delete the resulting secondary axis in the chart.
Format the Target data series.
The result is an easy to read performance versus target thermometer style chart.