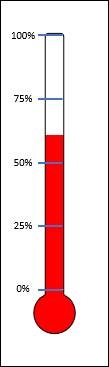
This is a pretty popular way to display a fundraising campaign’s current raised amount versus their goal or target amount.
Let’s look at how we can build this thermometer visual from scratch in Excel (and PowerPoint).
Video Tutorial
Creating A Thermometer Template In PowerPoint
We’ll need to head over to PowerPoint to create our thermometer template. As I explained in my traffic light dashboard visual post, PowerPoint has some extra merge shape commands we need to use to combine and cut out our thermometer template.
Creating our thermometer template in PowerPoint will require quite a few steps using shapes, merge commands, alignment and grouping. But once it’s created, we’ll be able to save it and use it over and over again. This is our basic thermometer template finished. We can save this PowerPoint file and use the thermometer template again and again. We’re done with PowerPoint and can head over to Excel. Copy and paste this template into your Excel Workbook to add the dynamic parts and finish creating the thermometer visual.
The Setup In Excel
The setup in Excel is pretty simple. We’ll need a current value and a goal value (shown in cells C2 and C3). We can set the current value based off a formula or pivot table that references the current data and sums it up. The goal value can be hard coded since it won’t usually be changing. Now, we’re going to add some conditional formatting data bars to these cells. Select cells C2:C3 ➜ go to the Home tab ➜ select Conditional Formatting ➜ Data Bars ➜ More Rule.
This will open up the New Formatting Rule menu. Most of the settings will already be set to what we need by default.
We will now have something that looks like above. The numbers don’t appear visible in the worksheet, but they are still there and can be seen in the formula bar if the active cell is on either C2 or C3.
Create A Linked Picture
The data bar on C2 is what will drive our dynamic thermometer visual. But we won’t be using it directly. We will be creating a linked picture to this cell. Linked pictures are dynamic. When the values and data bars change, so will the picture.
Copy the data bar for the current value. Then go to the Home tab ➜ select Paste from the clipboard section ➜ choose Linked Picture from the menu.
Now we can resize and rotate the picture to a vertical orientation with the filled part of the bar at the bottom.
Add The Linked Picture To The Thermometer Template
Now we just need to incorporate this linked picture of the data bar into our thermometer template. Temporarily set the current value to the goal value so we have a full data bar in our linked picture. This will allow for us to easily line up the linked picture to the 0% and 100% position of the thermometer.
Place the data bar linked picture over the template and line up the linked picture to the 0% and 100% position of the thermometer. We will need to place the linked picture behind the template. Select the linked picture and go to the Format tab ➜ select Send Backward ➜ choose Send to Back from the menu. When the linked picture is in the right place and behind the template, then we can group them together. Select both the linked picture and template then go to the Format tab ➜ and Group the objects together.
Conclusions
With a little help from PowerPoint, we now have a thermometer visual we can use to show a current value against a goal. This thermometer is dynamic and will change based on the current and goal inputs, so it’s perfect for interactive dashboards.